

Monitor your metrics and usage.
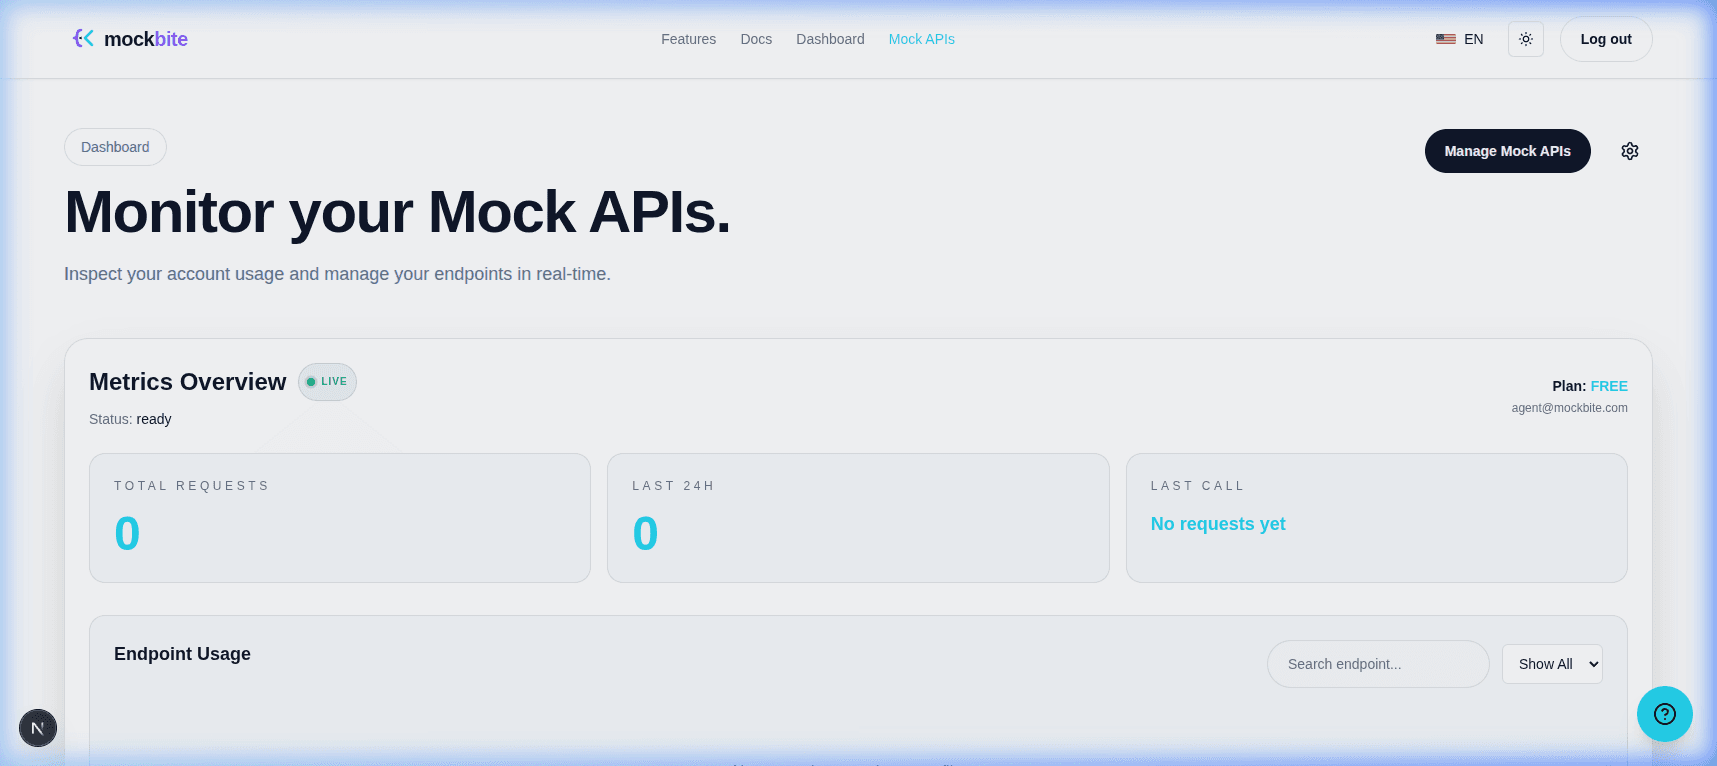
The dashboard provides a real-time overview of your Mock APIs, including requests over the last 24 hours, total request counts, and endpoint-specific usage breakdowns.
API Key Configuration
The Dashboard relies on your generated mb_ API key. Click the gear icon in the top right to generate, save, or clear your local API key.
Usage Graphs
Visualize traffic to specific endpoints. You can filter the chart by the top 5, top 10, or all active endpoints to quickly identify usage spikes.